Image: NOAA/SWPC
The Kp index is the single most-used number for aurora forecasting, but it is easy to misread. A Kp of 5 does not mean "definitely visible from my location" — it means the auroral oval has expanded to a certain geomagnetic latitude, and whether you can actually see it depends on your position, the horizon, cloud cover, and light pollution.
This guide maps Kp values to real locations so you can answer the question: "If the Kp is X, can I see aurora from where I am?"
For a full explanation of aurora forecasting, alerts, and photography, see the companion guide on Aurora Forecasting in Plain English.
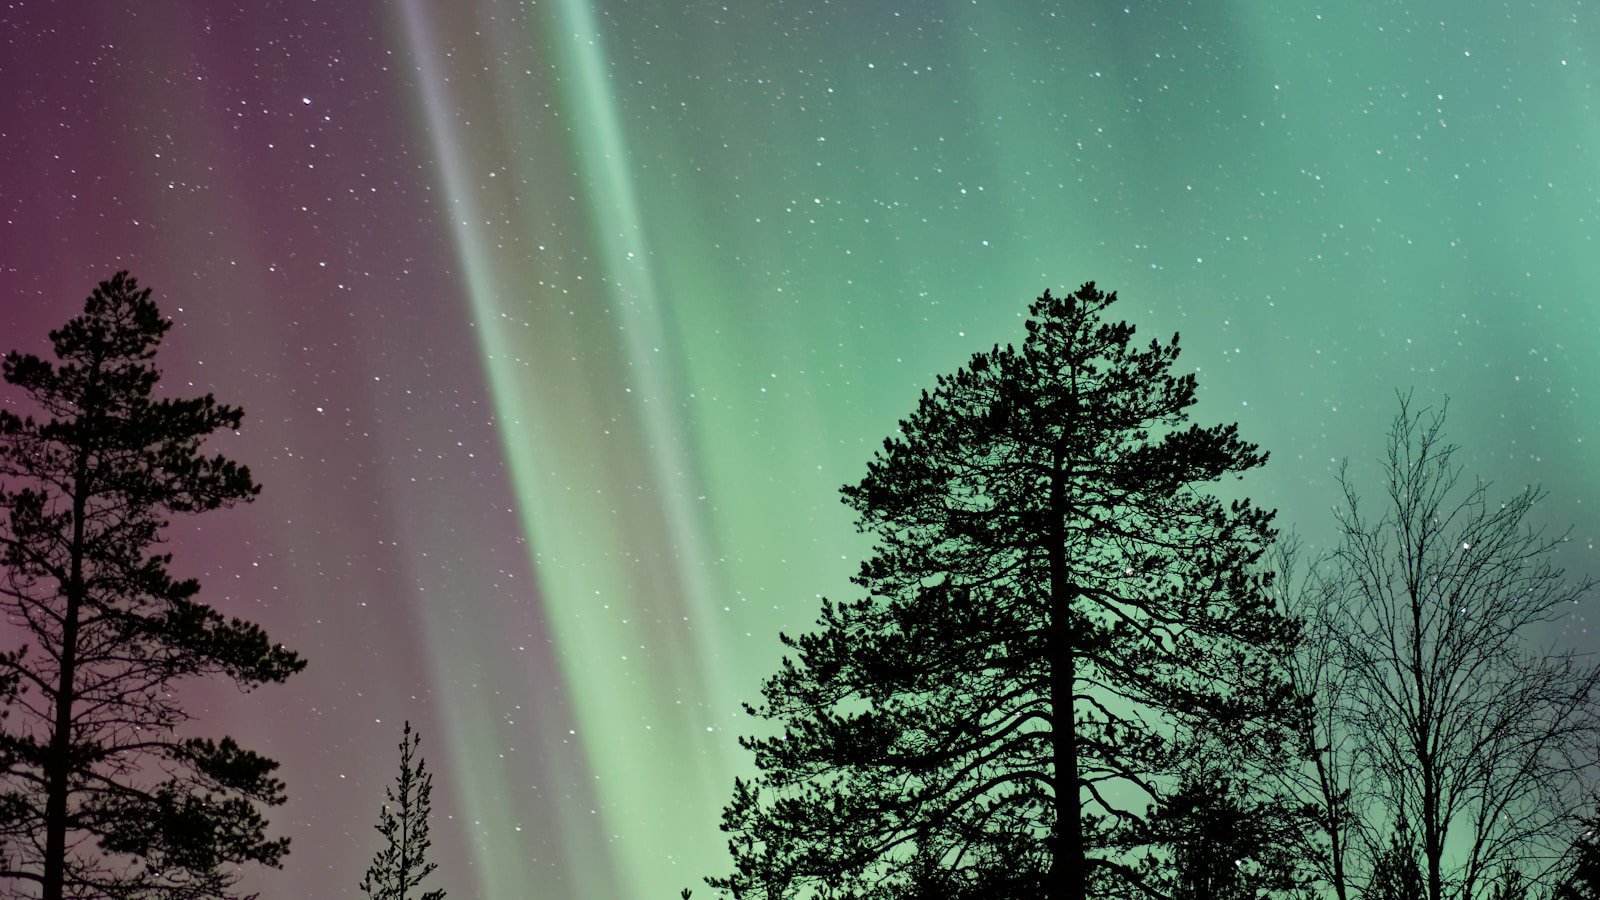
The aurora oval
Aurora occurs in a roughly oval-shaped band centred on the geomagnetic poles (not the geographic poles). As geomagnetic activity increases (higher Kp), the oval expands equatorward. The Kp index gives you a rough guide to how far south (in the Northern Hemisphere) or north (in the Southern Hemisphere) the aurora is likely to be visible.
Kp to visibility: Northern Hemisphere reference table
| Kp | Geomagnetic latitude (overhead) | Visible on horizon from | Example locations (visible on horizon) |
|---|---|---|---|
| 0–1 | ~67° N | ~62° N | Tromsø, Fairbanks, northern Iceland |
| 2 | ~65° N | ~60° N | Reykjavik, Bodø, Anchorage |
| 3 | ~63° N | ~58° N | Bergen, Trondheim, Juneau |
| 4 | ~60° N | ~55° N | Edinburgh, Oslo, Gothenburg, southern Alaska |
| 5 (G1) | ~58° N | ~52° N | Newcastle, Copenhagen, Hamburg, Seattle |
| 6 (G2) | ~55° N | ~48° N | Manchester, Amsterdam, Berlin, Portland OR |
| 7 (G3) | ~52° N | ~45° N | London, Paris (northern sky), Chicago, Minneapolis |
| 8 (G4) | ~48° N | ~40° N | Lyon, Vienna, Denver, New York |
| 9 (G5) | ~44° N | ~35° N | Madrid, Rome, Atlanta, Los Angeles (rare) |
Important caveats:
- "Visible on horizon" means the aurora may be seen as a glow low on the northern horizon, not overhead. Overhead displays require higher Kp or more northerly locations.
- Geomagnetic latitude ≠ geographic latitude. The offset between the geomagnetic and geographic poles means locations in North America generally see aurora at lower geographic latitudes than equivalent positions in Europe.
- These are approximate. The auroral oval is not a perfect circle and shifts in real time.
UK-specific reference
Since many FP Softlab readers are UK-based:
| Kp | UK visibility |
|---|---|
| 3 | Highlands of Scotland — faint glow on northern horizon |
| 4 | Central Scotland, Northern Ireland — clear glow, possible structure |
| 5 | Northern England, Scottish Borders — green glow, possible rays |
| 6 | Midlands, North Wales — distinct aurora, coloured curtains possible |
| 7 | Southern England, South Wales — visible from dark sites, looking north |
| 8+ | Overhead aurora possible across most of the UK (very rare) |
The best UK sites for aurora watching are along the north Scottish coast, the Scottish islands (Shetland, Orkney), and dark-sky locations in Northumberland and the Lake District.
Southern Hemisphere
The same physics applies in reverse. The southern auroral oval expands northward from Antarctica during geomagnetic storms. Visibility from populated areas:
| Kp | Visible from |
|---|---|
| 4–5 | Stewart Island and Southland (New Zealand), Tasmania |
| 6–7 | Christchurch (NZ), Melbourne (AU), Falkland Islands |
| 8–9 | Sydney (AU), Buenos Aires, Montevideo (very rare) |
How to use this table in practice
- Check the current or forecast Kp using NOAA SWPC or AuroraWatch UK
- Find your approximate location in the table above
- Assess conditions: clear sky? Dark location? North-facing horizon?
- If Kp matches or exceeds your threshold, go outside and look north (or south in the Southern Hemisphere)
- Be patient. Activity can be patchy. Give it at least 30–60 minutes.
What the Kp index does NOT tell you
- Whether the sky is clear — always check weather forecasts
- How bright the aurora will be — Kp measures geomagnetic disturbance, not optical brightness
- What colour you will see — green is most common; red, purple, and blue appear at higher energies
- Exact timing — the Kp is a 3-hour average. Substorms within that window can produce brief intense bursts
Tools for aurora planning
FP Softlab's Earth3D can help you visualise your geographic position relative to the auroral oval and the day/night terminator. The FP Softlab gallery includes reference imagery of atmospheric phenomena.